GaiaX Alerts#
GaiaX is a stream of alerts from the single field-of-view detector (1-FoV detector), as detailed in Kostrzewa-Rutkowska Z., et al., 2020.
Operating independently from the main Gaia Alerts stream, GaiaX provides the potential for studying multimesseger astrophysics. Using the Gaia precise photometric, astrometric, and spectroscopic measurements, coupled with its all-sky, multi-epoch survey capability, make it an effective tool for detecting electromagnetic counterparts to gravitational wave events.
[38]:
from GaiaAlertsPy.alert import GaiaX_history, GaiaX_alert

import numpy as np
from astropy.time import Time

# fancy plotting
import matplotlib.pyplot as plt
%matplotlib inline
%config InlineBackend.figure_format = "retina"
from matplotlib import rcParams
rcParams['savefig.dpi'] = 550
rcParams['font.size'] = 20
plt.rc('font', family='serif')
Load GaiaX alert release table from 2023:
[40]:
alerts_2023 = GaiaX_history('2023')
[81]:
alerts_2023[0:5]
[81]:
Table length=5
| Run | Earliest | Latest | No. of Alerts | Published | CSV |
|---|---|---|---|---|---|
| int64 | str19 | str19 | int64 | str19 | str14 |
| 7470 | 2023-12-28T23:32:13 | 2023-12-30T07:25:11 | 123 | 2023-12-31T17:10:03 | gaiax_7470.csv |
| 7469 | 2023-12-27T19:10:56 | 2023-12-29T08:56:45 | 159 | 2023-12-31T09:50:03 | gaiax_7469.csv |
| 7468 | 2023-12-26T20:28:36 | 2023-12-28T10:28:05 | 121 | 2023-12-29T09:40:03 | gaiax_7468.csv |
| 7467 | 2023-12-25T09:21:04 | 2023-12-27T10:19:27 | 119 | 2023-12-28T09:50:03 | gaiax_7467.csv |
| 7465 | 2023-12-25T04:55:03 | 2023-12-26T12:41:48 | 111 | 2023-12-27T15:30:03 | gaiax_7465.csv |
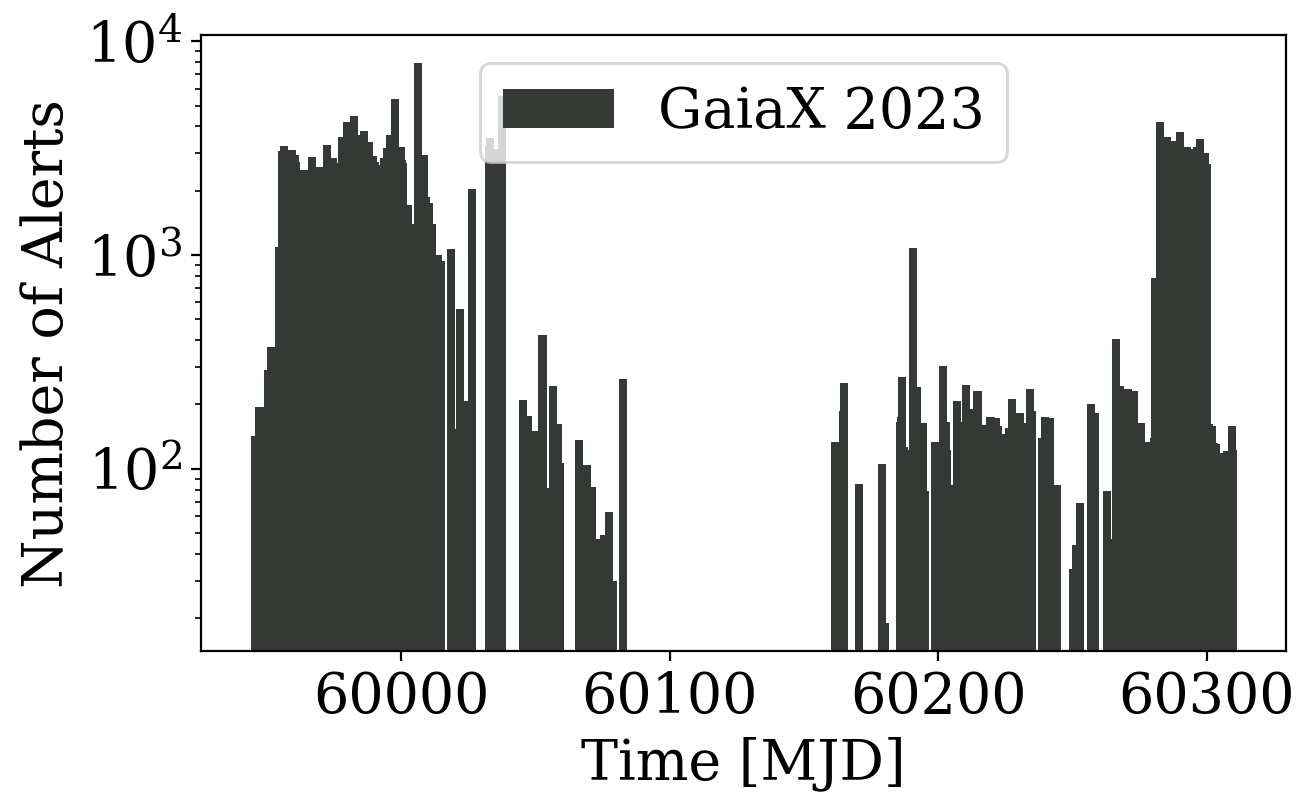
[55]:
plt.figure(figsize=(7, 4))
plt.bar(Time(alerts_2023['Published']).mjd, alerts_2023['No. of Alerts'], color='#353935', width=3,
        label='GaiaX 2023')
plt.legend()
plt.yscale('log')
plt.xlabel('Time [MJD]')
plt.ylabel('Number of Alerts')
[55]:
Text(0, 0.5, 'Number of Alerts')
Using the CSV extension, we can also load the alert data:
[95]:
alert_hist = GaiaX_alert('gaiax_7469.csv')

alert_hist[0:5]
[95]:
Table length=5
| Name | SourceID | ObsTime | RA | Dec | GMag | GMagErr |
|---|---|---|---|---|---|---|
| str14 | int64 | str19 | float64 | float64 | float64 | float64 |
| GaiaX23-280346 | 795575123163962752 | 2023-12-29T01:53:57 | 150.312982 | 35.333948 | 18.87 | 0.09 |
| GaiaX23-280345 | 795894668734561152 | 2023-12-29T01:53:13 | 150.205548 | 36.134564 | 18.36 | 0.03 |
| GaiaX23-280344 | 1763931334623322112 | 2023-12-29T01:24:05 | 317.471687 | 17.153644 | 20.32 | 0.05 |
| GaiaX23-280343 | 1763915013747597440 | 2023-12-29T01:23:57 | 317.570608 | 17.038779 | 20.59 | 0.05 |
| GaiaX23-280342 | 1763907317166204288 | 2023-12-28T23:37:11 | 317.611999 | 16.854227 | 18.73 | 0.03 |
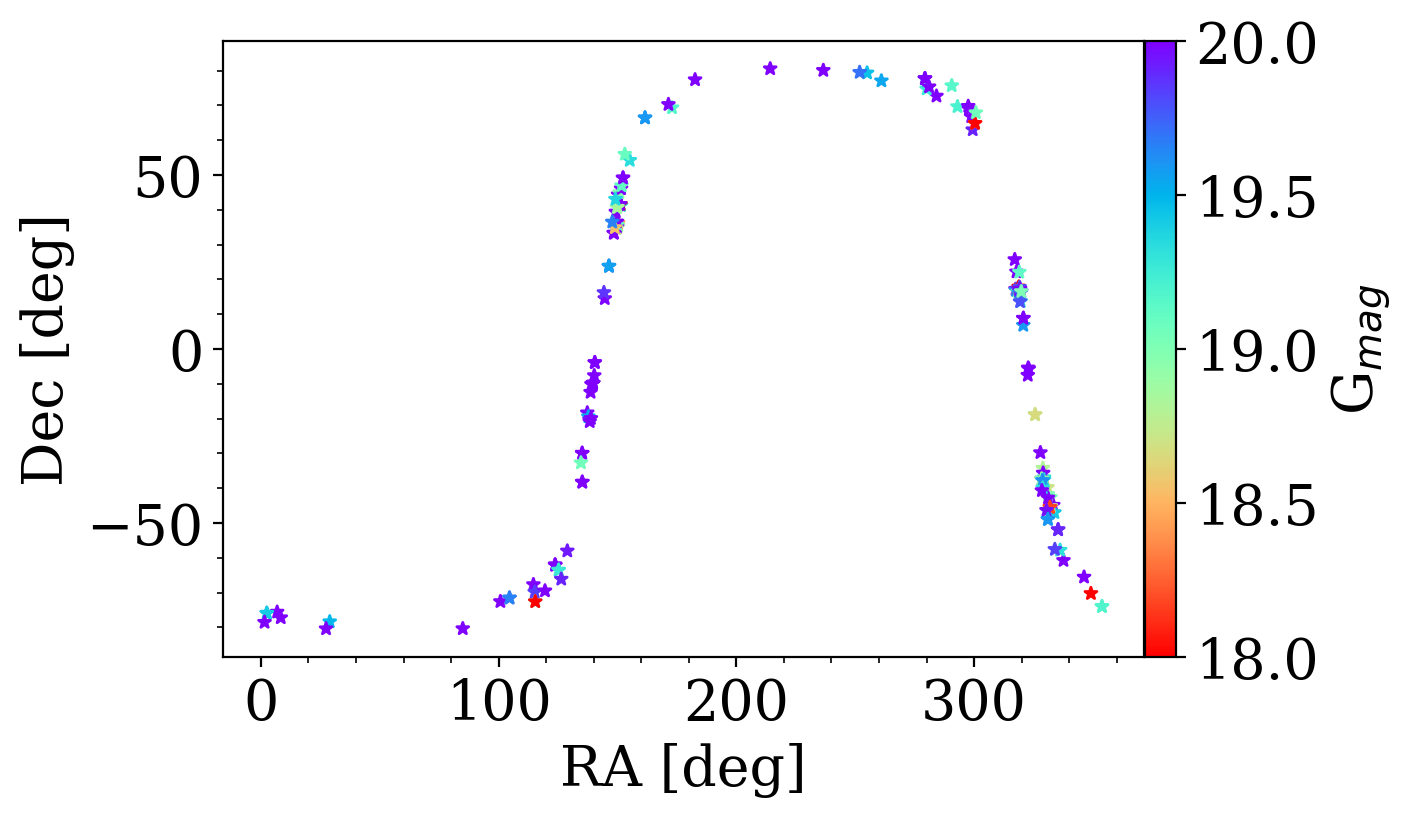
[101]:
plt.figure(figsize=(7, 4))
plt.scatter(alert_hist['RA'], alert_hist['Dec'], c=alert_hist['GMag'],
            cmap='rainbow_r', s=20, alpha=1, vmin=18, vmax=20., marker='*')
plt.colorbar(pad=0.001, label='G$_{mag}$')
plt.xlabel('RA [deg]')
plt.ylabel('Dec [deg]')
plt.minorticks_on()