Quickstart#
With GaiaAlertsPy installed, you can easily extract each detection from the Gaia alerts.
[4]:
from GaiaAlertsPy import alert as gaap
from matplotlib import rcParams

# fancy plotting
import matplotlib.pyplot as plt
%matplotlib inline
%config InlineBackend.figure_format = "retina"
from matplotlib import rcParams
rcParams['savefig.dpi'] = 550
rcParams['font.size'] = 20
plt.rc('font', family='serif')
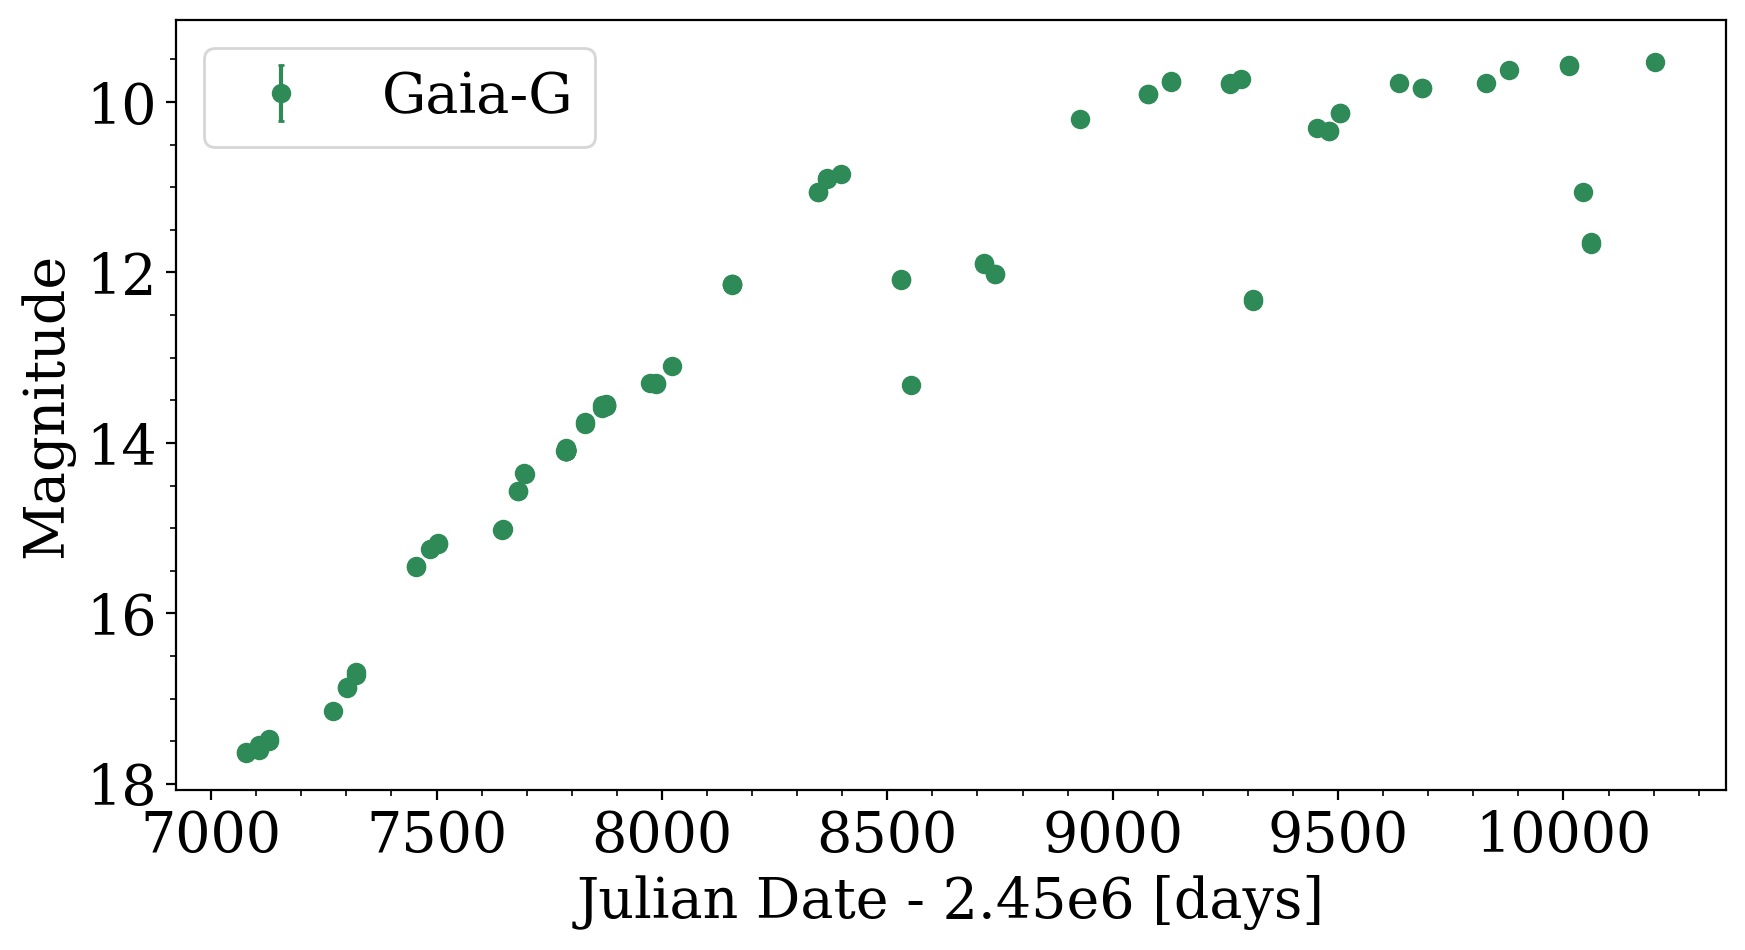
For example, let’s download and display the light curve for a specific alert, identified as Gaia20dvt. First, start Python and use the GaiaAlert class to obtain the light curve data for the alert from the data archive:
[11]:
target_id = "Gaia20dvt"
alert_lc = gaap.GaiaAlert(target_id).query_lightcurve_alert()
We can inspect the alert_lc table that returns all the detections:
[14]:
alert_lc[0:5]
[14]:
Table length=5
| JD | mag_G | mag_G_error |
|---|---|---|
| float64 | float64 | float64 |
| 2457078.0103472224 | 17.64 | 0.018908738194109986 |
| 2457078.084351852 | 17.63 | 0.018855080650021172 |
| 2457105.321666667 | 17.55 | 0.01843832729193906 |
| 2457105.4978009257 | 17.6 | 0.018696221071923702 |
| 2457128.992175926 | 17.48 | 0.01809111962074983 |
Plot the light curve:
[12]:
fig, ax = plt.subplots(nrows=1, ncols=1, figsize=(10,5))
ax.errorbar(alert_lc['JD']-2.45e6, alert_lc['mag_G'], alert_lc['mag_G_error'], fmt='o', capsize=1, color='seagreen',
label='Gaia-G')
ax.legend()
ax.set_ylim(ax.set_ylim()[::-1])
ax.set_xlabel("Julian Date - 2.45e6 [days]")
ax.set_ylabel("Magnitude")
plt.minorticks_on()